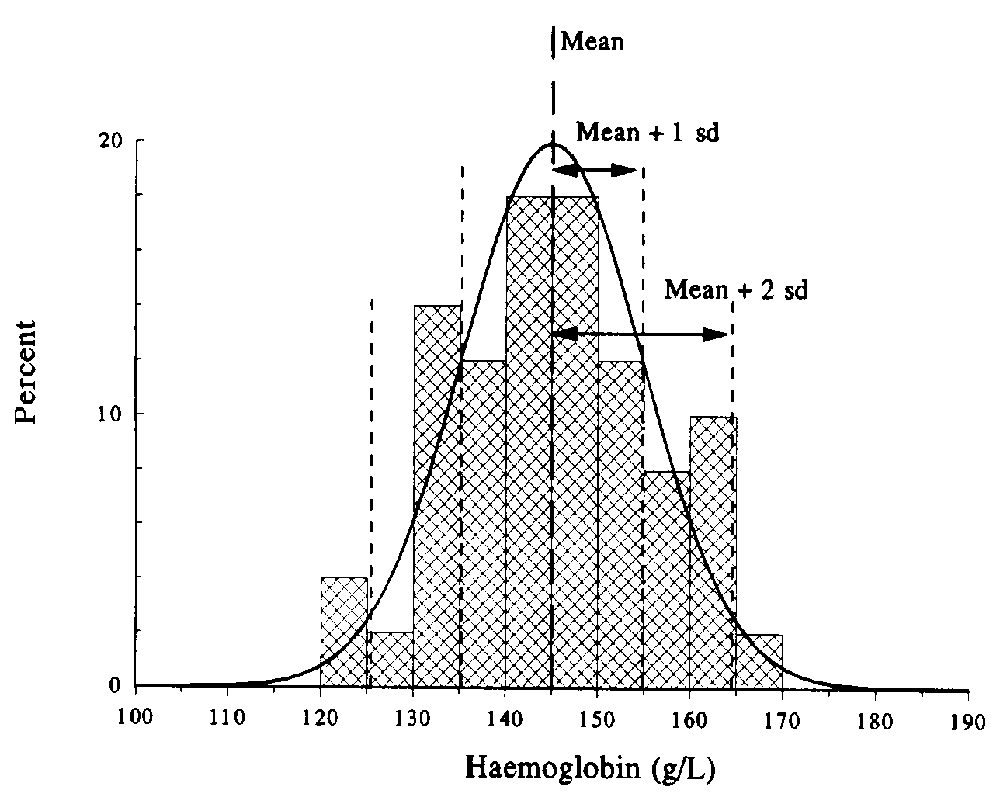
FIGURE 1. Histogram of haemoglobin levels among 196 men with superposed Normal distribution curve. Mean 145.0 g/l, standard deviation 9.8 g/L.
GFMER
Geneva Foundation for Medical Education and Research

FIGURE 1. Histogram of haemoglobin levels among 196 men with superposed Normal distribution curve. Mean 145.0 g/l, standard deviation 9.8 g/L.